Вернуться к статье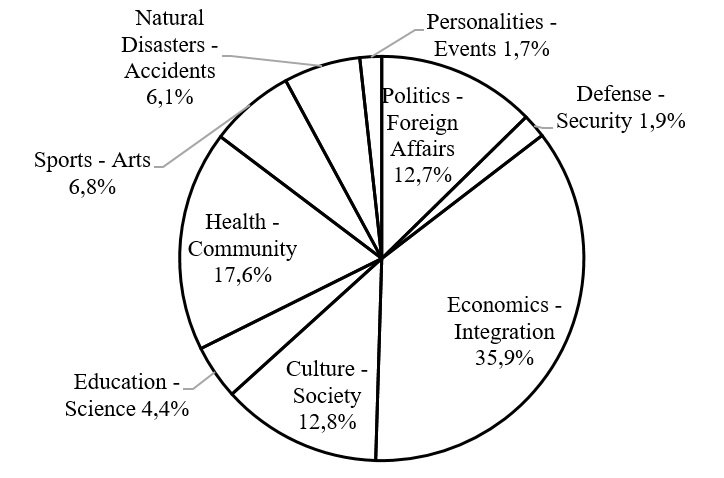
Инфографика во Вьетнамском информационном агентстве
Percentage distribution of the number of graphics in different categories on the VNA’s Tin Đồ Họa (Infographics) website during the period from 9/2022 to 9/2023
Percentage distribution of the number of graphics in different categories on the VNA’s Tin Đồ Họa (Infographics) website during the period from 9/2022 to 9/2023