Инфографика во Вьетнамском информационном агентстве
Инфографика во Вьетнамском информационном агентстве
Аннотация
В современное время значительно возросла роль визуальной коммуникации для облегчения обмена информацией между журналистами и обществом. Использование потенциала визуального восприятия является фундаментальным принципом в области визуализации информации в журналистике. Техника визуализации информации в журналистике включает: иллюстрации, фотографии, графику и различные мультимедийные форматы. Одним из мощных средств для эффективной передачи новостной информации является инфографика. В данной работе представлены результаты использования инфографики Вьетнамским информационным агентством с сентября 2014 года по настоящее время. За эти годы Вьетнамское информационное агентство создало 19596 графических работ. Было отмечено, что статичная графика превосходит динамическую во всех секторах и категориях. Глубокий анализ конкретных категорий показал, что категория “Экономика – Интеграция” занимает лидирующую позицию с 1194 работами (35,9%) с сентября 2022 года по сентябрь 2023 года. Показано, что графическая информация служит иллюстративным дополнением к статьям и представляет собой автономное произведение, отражающее всю статью.
1. Introduction
In the context of the increasing demand for receiving a large amount of information in the shortest possible time, information graphics have successfully fulfilled this task, evident in several aspects: News and events are the focal points of information graphics, capturing and accurately depicting ongoing events; Information graphics are presented briefly, visually, and in-depth, helping to elucidate the complex aspects of information; The content within information graphics aims for diversity and widespread dissemination, serving a large readership.
Currently, information graphics are not merely an illustration element for articles; they have even become an independent means of comprehensive presentation for entire articles. The transformation of extensive data into vivid and visual images has made complex statistical figures more understandable and less accessible information more engaging. The development of information graphics has become a significant strategy in building the brand of media organizations, especially in journalism, particularly online journalism.
With its pioneering position as an official media organization, the Vietnam News Agency (VNA) began introducing the public to information graphics early on, leading the way in bringing graphics to readers. Within VNA, media organizations have continuously evolved, innovated, and modernized their organizational structure and information activities. Information graphics have accumulated and developed on the platform of the VietnamPlus electronic newspaper and have now become an indispensable part of this online newspaper, helping to establish a strong presence in the reader community. In VNA, despite being founded later than other organizations, Vietnam News Television, or VNews, has chosen to integrate information graphics from the very beginning and has broadcasted its first programs. In print journalism, the newspapers “Báo Tin Tức” and “Tuần Tin Tức” (released weekly on Thursdays) have also embraced this direction.
As the “National News Bank” with the task of fulfilling the State news transmission function, VNA has been providing official and accurate information to domestic and international media organizations through 7 information units, producing nearly 30 diverse communication products. Among these, the Information and Graphics Center focuses on compiling and providing systematically structured documents from numerous reputable information sources related to significant current events at home and abroad. The center is promoting information graphics as a prominent information form for VNA.
2. Research methods and principles
In this research, the author explores the Vietnam News Agency’s Tin Đồ Họa (Infographics) website (https://infographics.vn/) from September 2022 to September 2023, after the page had been operational for nine years since September 2014. The research methodology for this work is based on document collection and analysis, information synthesis, data statistics, and comparisons to evaluate the effectiveness of using information graphics in journalism.
Theoretical basis. This study builds upon various research on information graphics domestically and internationally , , , et al. Accordingly, visualizing information in journalism encompasses diverse aspects. It can be classified into the following visual information types: drawings, photographs, graphics, and other multimedia content forms such as video, audio, etc. , . In Vietnam, editorial offices use multiple methods for visualizing journalistic information, with particular attention given to images, videos, graphics, and equivalent sources of written language.
Graphics is a familiar term in the design field, referring to using elements such as typography, color, shape, layout, and various other factors to convey specific messages. The term “information graphics” can be understood as the process in which an artist or designer creatively transforms information from its ordinary textual form into a graphic language. Graphics are crucial in creating visual, engaging, and creative information in communication. This is particularly significant in today’s era, where the demand for visually presenting data to attract readers is rising. In her work “Press and Multimedia Communication”, Nguyen Thi Truong Giang defines the term “Infographic” as the combination of “information” and “graphic”, specializing in using tables, charts, graphs, etc., in presenting data and news .
3. Main results
Information graphics play a crucial role in creating journalistic products that utilize graphics for illustrative purposes in the press activities of electronic media editorial boards. In journalistic works, graphics can appear as either supplementary components or exist independently as standalone journalistic works. Essential characteristics of modern information graphics need to be particularly emphasized, including the use of digital data, ensuring comprehensive yet non-overwhelming information, and creativity in conveying information through text within graphics. The classification of information graphics can be based on technology and principles of visual content representation.
Tarasenko suggests classifying infographics based on the principle of information self-sufficiency into independent and complementary, i.e., information that complements other materials.
Based on the principles of visual content representation, information graphics have two main categories:
(i) Data visualization: This type is used to represent and organize numerical data, such as charts, graphs, bar charts, and pie charts. It can be further divided into various subtypes, including scatterplots, line charts, pie charts, and many others.
(ii) Quality visualization: This type is used to represent and organize objects and qualitative data, including organizational charts, trend charts, flowcharts, process diagrams, knowledge mind maps, procedures, entities, and various visual elements like icons, symbols, arrows, and other visual cues.
From the perspective of the represented object, Avidenko identifies nine main types of infographics: statistical, timeline, map, scheme, hierarchy, matrix, algorithm, photo, comparison.
From a technological perspective, various categories of infographics exist, including static infographics (which convey factual information, numerical data, and their interconnections through diagrams, tables, and graphs), dynamic infographics (which capture the evolving dynamics of development or progress), and video infographics, currently experiencing a surge in popularity in the realm of broadcasting , .
Results from a survey conducted among the press agencies of Vietnam News Agency show that various forms of graphics are predominantly used, including data tables, maps, diagrams, charts, graphs, timelines, and interactive graphics. The graphic works categorized as “Infographics” in VNA-owned newspapers such as Vietnamplus, Báo Tin Tức, and Truyền Hình Thông Tấn primarily derive their content from the Tin Đồ Họa (Infographics) website of VNA (https://infographics.vn/).
Over the nine years from September 2014 to September 2023, VNA’s Tin Đồ Họa (Infographics) website produced and published 19596 graphic works. Static graphics significantly outweighed dynamic graphics in all fields and categories, evident in the percentage of static graphic works within nine categories, as depicted in Figure 1. Specifically:
1) Politics – Foreign Affairs: 98.3% static graphics out of 2858 graphic works;
2) Defense – Security: 97% static graphics out of 765 graphic works;
3) Economics – Integration: 79.8% static graphics out of 5270 graphic works;
4) Culture – Society: 94.7% static graphics out of 2212 graphic works;
5) Education – Science: 97.3% static graphics out of 852 graphic works;
6) Health – Community: 82.7% static graphics out of 4644 graphic works;
7) Sports - Arts: 98.6% static graphics out of 1177 graphic works;
8) Natural Disasters – Accidents: 99.1% static graphics out of 1338 graphic works;
9) Personalities – Events: 100% static graphics out of 480 graphic works.
It can be observed that static graphics demonstrate diversity through various forms, such as numerical data, charts, maps, diagrams, timelines, instructional graphics, process flowcharts, methods of implementation, listings, comparisons, and many other types. Meanwhile, dynamic graphics primarily focused on two forms: interactive graphics and videographics. Both require significant investments in time, creativity, careful design, and advanced technological skills. Therefore, journalists often prioritize the use of static graphics for their products.
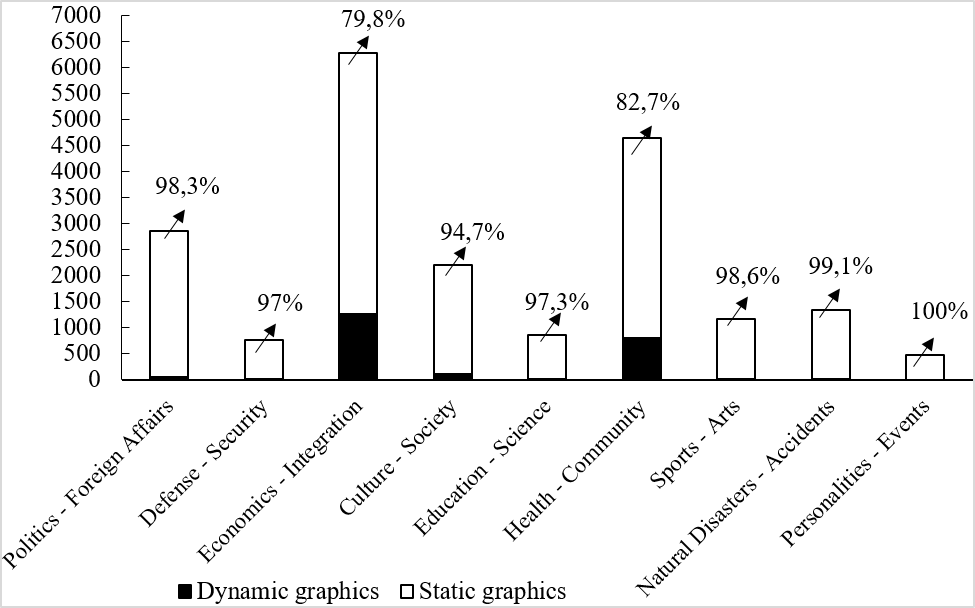
Figure 1 - The number of graphics on the VNA’s Tin Đồ Họa (Infographics) website during the period from 9/2014 to 9/2023
Figure 2 illustrates the percentage distribution of the number of graphics within each category during the 12 months from 9/2022 to 9/2023. During this time frame, several noteworthy points can be observed: The Economic – Integration category leads with 1194 works, accounting for 35.9% of the total 3326 works, followed by the following categories: Health – Community (587 works – 17.6%), Culture – Society (426 works – 12.8%), Politics – Foreign Affairs (421 works – 12.7%), Sports – Arts (227 works – 6.8%), Natural Disasters – Accidents (204 works – 6.1%), Education – Science (145 works – 4.4%), Defense – Security (64 works – 1.9%), and Personalities – Events (58 works – 1.7%).
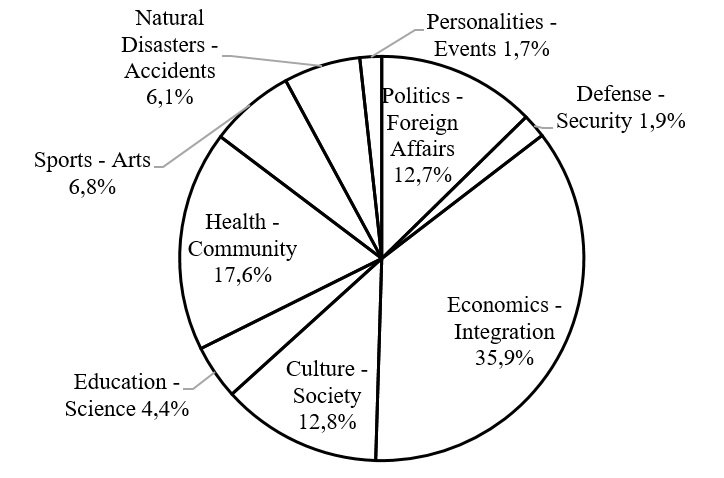
Figure 2 - Percentage distribution of the number of graphics in different categories on the VNA’s Tin Đồ Họa (Infographics) website during the period from 9/2022 to 9/2023
4. Discussion
Regarding the types of graphics, static graphics still maintain a considerable predominance. In the Economic – Integration category, graphical forms like charts and graphs excel in visually presenting large and complex datasets. Science and education categories often favor diagrammatic, instructional, and procedural graphics.
Timelines are frequently utilized in categories such as Politics - Foreign Affairs and Personalities – Events, aiding in clear and logical chronological information delivery. In particular, Timelines are a distinct graphic type on the page, placed within a specific category and ensuring a professional approach to information presentation. The result demonstrates the page’s focus and emphasis on this graphic format.
Additionally, interactive graphics are becoming increasingly popular, attracting reader interest due to the rising quantity and quality. Over the 12 months, the survey results indicate a significant increase in interactive graphic works, with an impressive figure of 1373 works. The quality of these works has significantly improved, as evidenced by active reader interaction. Clear signs of the effectiveness of using interactive graphics include increased user engagement and comments on these graphics, demonstrating a positive reception from readers for this format. Therefore, interactive graphics are evolving into a powerful and effective tool for information dissemination and reader engagement.
The VNA’s Tin Đồ Họa (Infographics) website offers various utilities to users. In addition to allowing full-screen viewing of graphics, users can also download graphic works in jpg format for storage and use in different contexts. These enhancements and flexible options highlight the continuous development of the VNA’s Tin Đồ Họa (Infographics) website in providing quality information and creating a good reader experience through the scientific use of graphics in journalism.
While professional graphic design tools like Photoshop, Illustrator, and InDesign can be used, journalists can optimize their time and resources by utilizing online design platforms with diverse features and valuable suggestions. Information technology is continually upgraded and developed, so graphic designers must continuously update their knowledge and hone their skills to become experts in using software and avoid falling behind.
5. Conclusion
The study has yielded the following conclusions. 1. Over the nine-year survey period, static graphics have consistently maintained a substantial advantage over dynamic graphics in all fields and categories. 2. In the most recent year of the survey, the prevalent types of graphics were interactive graphics, timelines, charts, and graphics illustrating implementation methods. 3. When examining the utilization of information graphics across different fields, it has been consistently observed that Economic – Integration, and Health – Community hold the top positions throughout the entire survey duration. 4. The Vietnam News Agency introduced information graphics to the public early and is presently a pioneer in disseminating graphic content to its readers. Moreover, this agency continually updates and adapts novel information graphics forms to suit Vietnamese journalism’s distinctive context.